To use statistical tools, data must be organized as variables x samples matrices: these can come from the XCMS preprocessing tool or from software provided by equipment suppliers (such as BrukerTopSpin and BrukerAmix used for NMR data preprocessing).
Batch correction
This MS-specific tool is dedicated to data correction from analytical drift, which results in a decline of detection capacity during an injection sequence due to clogging in ionization source. It also corrects the intensity differences due to source cleaning among the different injection sequences (as shown in Figure 5). The Batch correction tool is based on the algorithm mentioned by Van der Kloet ([8]). It corrects inter and intra batch effects using linear or loess modelling of the drift, based on quality control pooled samples injected regularly in the sequence.
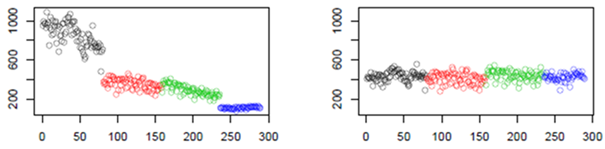
Figure 5: Data correction from analytical drift.
Univariate tests
Classical parametric and non-parametric univariate tests are available to analyze qualitative variable with 2 levels (Student test / Wilcoxon test) or more (Analysis of variance / Kruskal-Wallis test) or to analyze quantitative variable (Pearson or Spearman correlation test). The Multiple comparison correction methods implemented in the R software are included in this tool.
Global adjusted p-values, and the corresponding decisions (as 0/1) according to the selected threshold are provided as outputs.
Multivariate analysis
Partial least-squares regression (PLS) and its orthogonal variant (OPLS) are currently the most popular multivariate method in metabolomics for modelling quantitative or qualitative factor of interest and selecting the variables most contributing to the model (Trygg et al. [9]; Pinto et al. [10]). We thus implemented the original algorithms described by Wold and Trygg in the "Multivariate" Galaxy module within W4M. This module enables the user to perform both unsupervised (PCA) and supervised (PLS, OPLS, PLS-DA, OPLS-DA) analyses. The metrics and corresponding graphics to assess the value of the model, and the variable importance in projection are provided as outputs (Figure 6; see the documentation and example page of the "Multivariate" module).
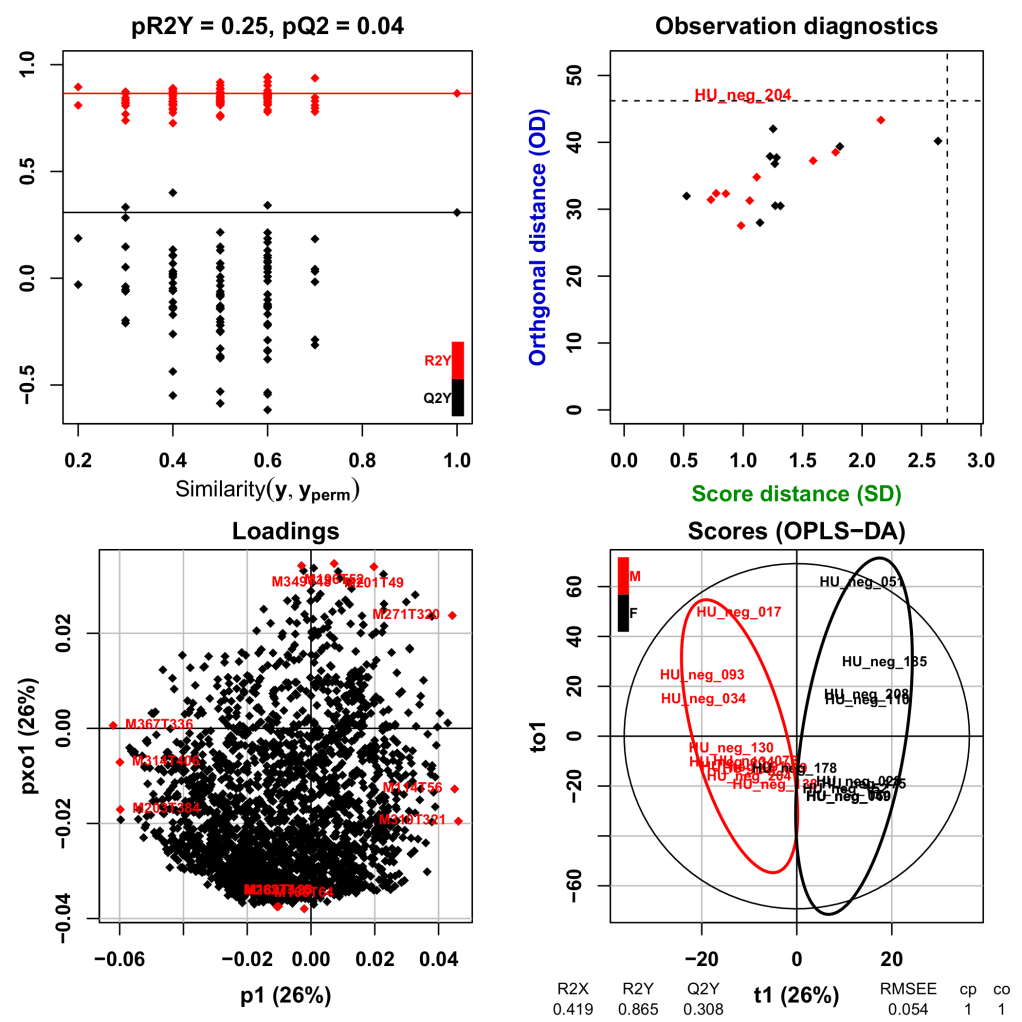
Figure 6: Example output graphics for OPLS-DA models. The "gender" factor has been modelled by using the example dataset on W4M. Top left: Permutation testing to assess the significance of the R2Y and Q2Y values. Top right: Diagnostic plot to highlight observations which would be far from the projection plane or, within this plane, far from the center. Bottom left: Loading plot. Variables with the most extreme values along each axis are in red. Bottom right: Score plot for the first predictive and the first orthogonal component. Ellipses corresponding to 95% of multivariate normal distribution for each gender are indicated in colors.